Tuesday, December 24, 2024

SUBJECT ENRICHMENT ACTIVITIES CLASS 4 ENGLISH

 SUBJECT ENRICHMENT ACTIVITIES

CLASS 4 SUBJECT ENGLISH


ACTIVITY 1:  DIFFERENT AND TYPES OF FLOWERS PICTURES  AND THEIR NAMES. 


CRITERIA FOR ASSESSMENT:


★ Creativity


★ vocabulary


★ Spelling


★ Content


ACTIVITY 2-  Dramatization (Tree and a boy)


CRITERIA FOR ASSESSMENT


★ Participation


★Sentence formation


★ Creativity


★ A Content


ACTIVITY 3:  IF I WERE A MANGO TREE CREATIVE WRITING


★ CRITERIA FOR ASSESSMENT


★WRITING SKILL


★CREATIVITY


★ CONTENT


★ SENTENCE FORMATION


★ GRAMMAR


ACTIVITY 4: POEM RECITATION (Books)


CRITERIA FOR ASSESSMENT:


★KNOWING THE POEM 


★Pronunciation


★Gestures


★INTONATION.


ACTIVITY 5: PUPPET SHOW (PINACCHIO)


CRITERIA FOR ASSESSMENT

★ CREATIVITY


☆ PUPPET MAKING


★ Participation


★ Sentence formation


★ Conversation (Dialogue making)


STATISTICS TEST GRADE 6

 STATISTICS TEST GRADE 6 

TOTAL = 4 QUESTIONS X 5 MARKS = 20 MARKS


Thursday, December 12, 2024

NCERT Class 9 Maths Lab ACTIVITY 10– To draw histogram of heights of students of your class.


NCERT Class 9 Maths Lab ACTIVITY 10

– To draw histogram of heights of students of  your class.

Objective
To draw a histogram representing the heights of students using the provided data.

Materials Required

  1. Graph paper

  2. Geometry box

  3. Adhesive

  4. Sketch pens

  5. Scissors

  6. A piece of cardboard

Prerequisite Knowledge

  1. Knowledge about collection of data.

  2. Concept of histogram.

Step-by-Step Procedure

1. Organize the Data

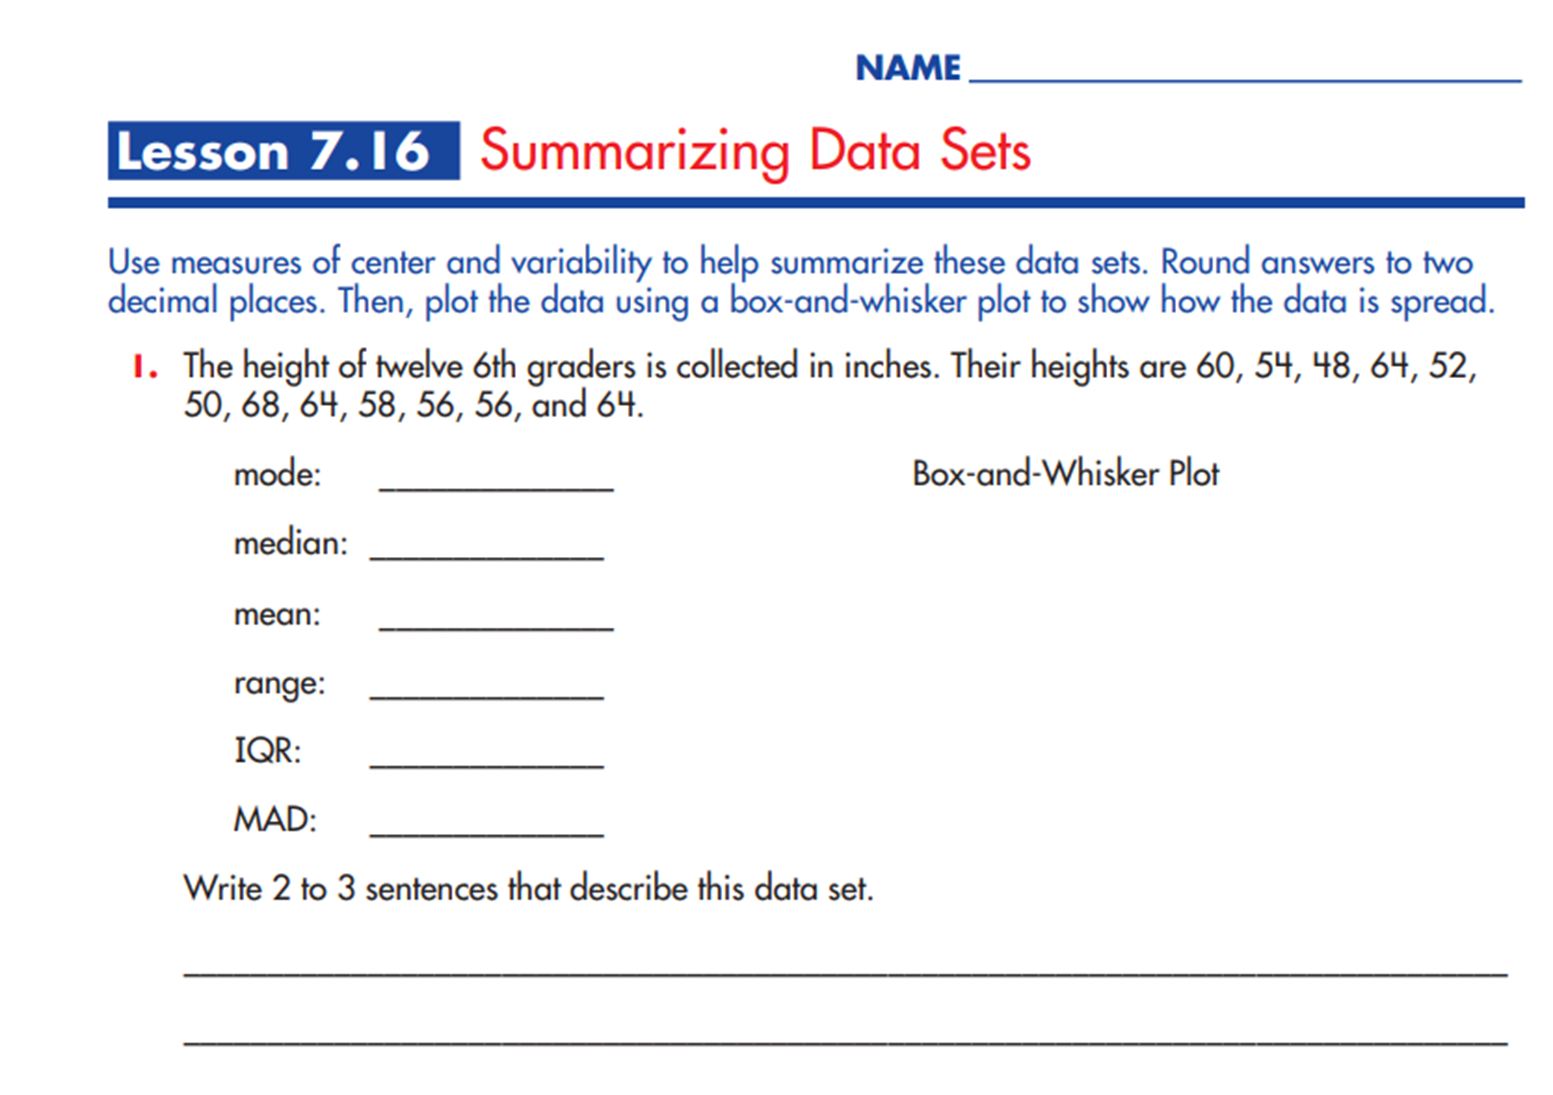
The given heights are:
157, 159, 170, 144, 156, 163, 164, 154, 163, 164, 158, 152, 165, 157, 171, 164, 172, 162, 150, 170, 151, 157, 170, 159, 163, 201, 168, 171, 160, 191, 164, 170, 182, 154, 167, 165, 171, 168, 188, 176, 160, 184, 184, 177, 165, 166.


Class

a-b

b-c

c -d

d -e

e-f

g-h

i-j

Frequency

f1

f2

f3

f4

f5

f6

f7


2. Determine Class Intervals

Group the heights into equal-sized class intervals (e.g., 140–150, 150–160, 160–170, etc.) and count the number of heights in each interval (frequency).

Class Intervals and Frequency Table:
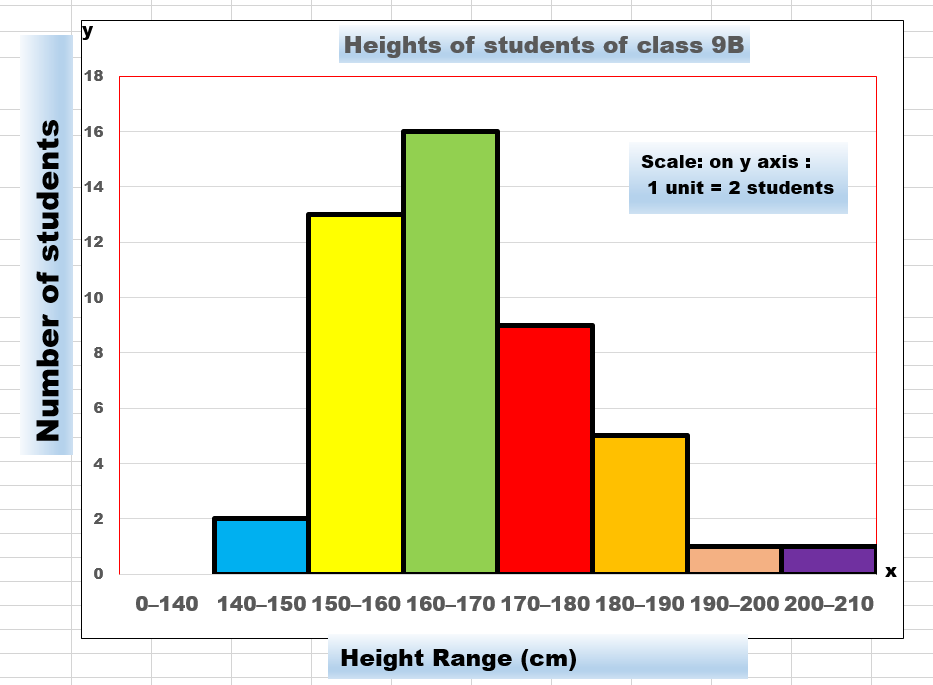
Height Range (cm)

Frequency

140–150

2

150–160

13

160–170

16

170–180

9

180–190

5

190–200

1

200–210

1


3. Draw Axes and Scale

  • X-Axis: Represent the height intervals (class intervals).

  • Y-Axis: Represent the frequency (number of students).

  • Use a consistent scale for both axes.


4. Draw the Histogram

  • Draw rectangles (bars) for each class interval.

  • The height of each rectangle corresponds to its frequency.

  • Ensure there is no gap between rectangles.


Observations
Graphical Representation

For the classes of equal widths,

The intervals are

  • a-b = ………..  140–150: Bar height = 2

  • b-c = …………150–160: Bar height = 13

  • c-d = ………….. 160–170: Bar height = 16

  • d-e = ……….170–180: Bar height = 9

  • e-f = ………..180–190: Bar height = 5

  • g-h = ………..190–200: Bar height = 1

  • i-j = ………..200–210: Bar height = 1

Frequencies are

f1 = ………… 2
f2 = ………..13
f3 = …………. 17
f4 = ………….9
f5 = …………..5

f6 = …………..1

f7 = …………..1


Result
We have drawn a histogram of equal widths and varying widths by using the collected data of the heights of students.

Application
Histograms can be used pictorially in representing large data in a concise form.


Friday, December 6, 2024

Math magic

Math magic 

In mathematics, no number can be divided by all the numbers between one and ten.
But only one number was considered a mystery by mathematicians around the world. It can even be said that it gave them a shock.
This number was discovered by the unshakable talent of mathematicians of India.
That number: 2520
At first glance, it seems like one of many numbers.
But it is not like that. A number that gave them an insurmountable surprise even by mathematicians around the world!
Because it was a number that could be divided by any number between 1 - 10 - be it an odd number or an even number!
This may give a lot of surprise: it may even seem impossible.
 Look at the mathematical table below:


2520 ÷ 1 = 2520

2520 ÷ 2 = 1260

2520 ÷ 3 = 840

2520 ÷ 4 = 630

2520 ÷ 5 = 504

2520 ÷ 6 = 420

2520 ÷ 7 = 360

2520 ÷ 8 = 315

2520 ÷ 9 = 280

2520 ÷ 10 = 252


The mystery of this has been solved:
[7 × 30 × 12] - This is the multiplication!
According to the calendar followed by our Bharat, an answer has been found for this puzzle.
 The coefficient of this number
Days in a week - 7
Days in a month - 30
Months in a year - 12
*[7 × 30 × 12 = 2520] This is the characteristic and dominance of time.*
(This is the characteristic and dominance of time )
Finally.. that wonderful mind who discovered this -
Mr. Srinivasa Ramanujam.
Let us bow our heads and worship that venerable genius.. great man.
The Great Mind who discovered it was Sri Srinivasa Ramanujam !

WORKSHEET ch1 class 6

WORKSHEET - Number pattern 1)  1,3,5,7, ________, ___________,  _______ Rule- ________________ 2)  2,4,6,8,________, ___________,  _______ R...