Wednesday, May 21, 2025

Class 6 NCERT bridge course Answers Activity W3.2 Exploring Coordinates on a Checkerboard Grid

 Activity W3.2 

Ask the students to take a piece of paper that looks like a big checkerboard, 

with lots of little squares on it. 

Each of these squares has its own special address, i.e., giving each square a name so that we can find it easily. 

 Give the students two numbers, say (3, 4), to tell us where a square is. 

 The first number tells us how far to move to the right.

 The second number tells us how far to move up or down.

 Give plenty of such numbers and ask them to plot these on the grid.

 This gives them an intuitive idea of the coordinate system.

 Students may try plotting some points on our own grid! 

It's like connecting the dots to reveal a hidden picture. 

(Please provide such graphics for connecting dots as hands on activity)

 Plastic mesh grid or geo board may be used for students with visual challenges.


Activity W3.2: Exploring Coordinates on a Checkerboard Grid

Objective:
Help students understand the concept of coordinates as addresses on a grid, by plotting points given as ordered pairs (x, y).

Procedure:

  1. Introduce the Checkerboard Grid:
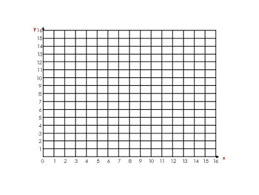
    Provide students with a sheet of paper printed with a big checkerboard or grid made up of small squares (for example, a 10x10 grid).

  2. Explain the Coordinates:
    Each square on the grid has a special address or coordinate, written as a pair of numbers (x, y).

    • The first number (x) tells how many squares to move to the right starting from the origin (bottom-left corner).

    • The second number (y) tells how many squares to move up from the origin.

  3. Plotting Points:
    Give students coordinate pairs such as (3, 4), (1, 7), (5, 2), etc.
    Ask them to find the corresponding squares on the grid and mark those points with a dot or sticker.

  4. Connect the Dots:
    Once all the points are plotted, students connect the dots in the order given to reveal a hidden shape or pattern. This can be a simple shape like a house, a star, or a letter.

  5. Encourage Creativity:
    Invite students to create their own sets of coordinates and swap with classmates to plot and reveal new pictures.

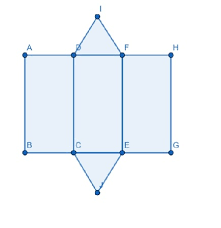
Example Coordinates to Plot (for a simple house shape):

PointCoordinates (x, y)
A(2, 2)
B(2, 5)
C(4, 7)
D(6, 5)
E(6, 2)
F(2, 2)
Connect points A → B → C → D → E → F to outline the house.

Additional Notes:

  • For students with visual challenges, use a plastic mesh grid or geoboard with tactile strings or rubber bands to feel the shape.

  • Encourage using colorful markers or stickers for points and lines.

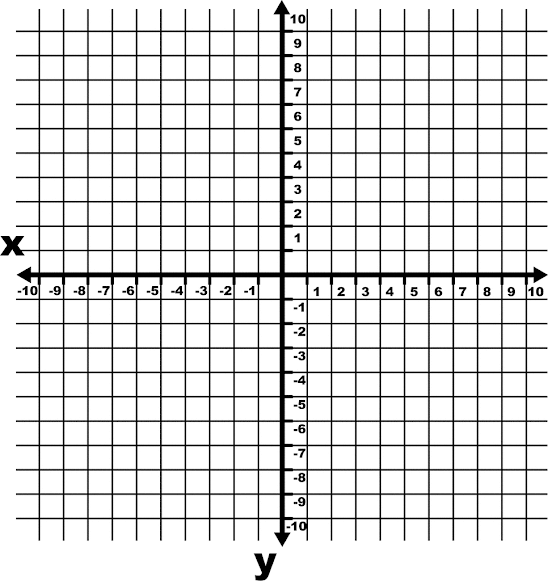
  • To visualize the coordinate system better, label the x-axis and y-axis clearly on the grid.


  • A large grid (10x10 squares) labeled with numbers along the bottom (x-axis) and side (y-axis).


  • Points plotted at example coordinates.


  • Lines connecting points to form a simple recognizable shape (e.g., house).


  • A blank grid for students to try their own plotting.


Class 6 NCERT bridge course Answers Activity W3.1 Exploring Directions on a Map

 Activities for WEEK-3
Using the Informal Coordinate System to Draw a Map
 Activity W3.1 Exploring Directions on a Map

 In this activity students will explore different places using a map and understand the value of directions mentioned in it. 

 Ask them to get a Map of their school. 

 They may be asked to look for a compass rose on the map. 

 It's usually a small star or flower-like symbol with arrows pointing in different directions.

 This handy tool will guide them as they explore directions. 

 They may be familiarised with the four main directions: 

1. North is at the top of the map. 

2. South is at the bottom. 

3. East is on the right side. 

4. West is on the left side. 


 They may be asked to face a certain direction. 

 They may then use the compass rose to figure out which direction they are facing.

 It's like using a compass to find their way. 

 Now, allow them to try to locate different places on the map using the directions they have learned. 

For example, they might find their classroom to the north of the playground. 

 You may call out a direction, and the student should point to that direction on the map.  

The map can be made tactile with Braille labelling.


Activity W3.1: Exploring Directions on a Map

Theme: Using the Informal Coordinate System

Objective:

To help students understand how to:

  • Read a map using cardinal directions (North, South, East, West)

  • Identify landmarks in relation to each other

  • Use informal coordinate systems and spatial reasoning

  • Introduce tactile learning (for inclusive education)

Materials Needed:

  • A map of the school (can be teacher-created if not available)

  • Compass rose diagram (printed or drawn)

  • Braille label sheets (if available, for inclusive support)

  • A4 sheets for students to sketch their own maps

  • Pencil and ruler

Concepts Involved:

  • Cardinal directions (N, S, E, W)

  • Relative location (e.g., “Library is east of the main gate”)

  • Map orientation

  • Visual and tactile learning

  • Spatial awareness

Procedure:

  1. Start with a Map:
    Distribute a map of the school to each student or group. Include a compass rose on the map.

  2. Discuss the Compass Rose:

    • Explain that North is usually at the top.

    • South is at the bottom.

    • East is to the right.

    • West is to the left.

    • You may even create a fun mnemonic like “Never Eat Soggy Waffles” to help them remember.

  3. Explore Directions:
    Ask students to:

    • Stand and face North (as per the map).

    • Then ask them to turn and face East, South, and West.

  4. Locate Landmarks:
    Ask students to locate the following using directional clues:

    • “What is to the west of the assembly ground?”

    • “Which building lies north of the playground?”

    • “Where is the staff room in relation to the principal’s office?”

  5. Interactive Play:
    You can turn it into a game:

    • Call out directions like “Point to the east on your map!”

    • Or ask: “What do you find if you go south from the library?”

  6. Tactile Support:

    • Add Braille labels or raised symbols for key locations (classroom, library, toilet, playground).

    • This ensures inclusion for visually impaired learners.

Examples:

LandmarkRelative Location Example
LibraryEast of the Staff Room
PlaygroundSouth of the Main Gate
Classroom 5ANorth of the Computer Lab
Principal's OfficeWest of the Reception
CanteenBetween the Science Lab and Art Room

Compass Rose Symbol:

Sample Answers to Map Questions:
  • Q: What is east of the playground?
    A: The library.

  • Q: What lies to the north of the school garden?
    A: The classrooms.

  • Q: If the student is standing at the main gate, in which direction do they walk to reach the science lab?
    A: Walk north.

Discussion & Reflection:

  • How did the compass rose help you find your way?

  • What would happen if you didn't know which direction was north?

  • Can we use directions at home or in our neighborhood?

Conclusion:

This activity gives students real-world map reading skills while enhancing their spatial intelligence and orientation sense. It also makes room for inclusive education through tactile and visual tools.


Class 6 NCERT bridge course Answers Activity W2.7 Rangoli Making

 Activity W2.7 Rangoli Making 

 In this activity students will be able to make different shapes using the chart paper and 

then arrange them into beautiful rangoli/ kolam 

 Ask the children (in group) to make different shapes using coloured chart papers. 

They may be asked to make different rangoli/kolam.


Activity W2.7: Rangoli Making – Exploring Geometry Through Art

Objective:

To help students explore geometry, symmetry, patterns, and aesthetic design through a creative and collaborative activity—making rangoli (kolam) using cut-out shapes.

This activity strengthens spatial understanding, shape recognition, and artistic expression.

Materials Needed:

  • Colored chart paper

  • Scissors

  • Glue or double-sided tape

  • Pencils, rulers, and compasses (for precision)

  • A3 or A2 sized base sheet for pasting designs

Concepts Involved:

  • 2D shapes (triangles, squares, circles, rhombuses, hexagons, etc.)

  • Symmetry and reflection

  • Pattern and repetition

  • Tiling and tessellation

Procedure:

  1. Group the students into small teams of 3–5 members.

  2. Ask them to cut out basic shapes like:

    • Squares

    • Triangles

    • Circles

    • Semicircles

    • Petals

    • Diamonds/rhombuses

    • Stars

  3. Each group should design their own rangoli/kolam on chart paper or a flat surface by:

    • Arranging shapes in symmetric or circular patterns

    • Exploring repetition and rotation

    • Using contrasting colors for beauty

  4. Once satisfied, students can paste the shapes onto a base sheet.


Examples of Rangoli Designs:

Design NameDescriptionShapes Used
Lotus MandalaPetals arranged in a circular patternOvals, circles, triangles
Geometric Star RangoliStar at the center with repeated diamond shapesStars, diamonds, triangles
Symmetry ButterflyMirror-symmetric design of a butterflySemicircles, triangles
Flower Garden KolamRepeated flower patterns in a gridCircles, petals, squares

Discussion Questions:

  1. What shapes did you use in your design?
    ➤ Answers will vary: squares, circles, triangles, etc.

  2. Was your rangoli symmetrical?
    ➤ Many designs will be symmetrical; ask how they achieved that.

  3. Did you face challenges while arranging the shapes?
    ➤ Some might mention fitting or matching angles and sizes.

  4. What makes one design more visually appealing than another?
    ➤ Use of color contrast, repetition, symmetry, and balance.

Conclusion:

This activity combines mathematics with art, reinforcing concepts of geometry, area, symmetry, and design in a fun and engaging way. It fosters teamwork, creativity, and appreciation of traditional cultural art forms like kolam or rangoli.

Class 6 NCERT bridge course Answers Activity W2.6 Exploring Area – Same Area, Different Shapes Using Strips

Activity W2.6: Exploring Area – Same Area, Different Shapes Using Strips

 Take 16 cutouts of a strip. 

The dimension of the rectangle is 16 x 1 units.

Arrange them in a square shape of dimension 4 x 4 units.

These can also be arranged is a shape of dimension 8 x 2 units.

The regions in all these cases are different but the amount of region occupied by them 

i.e., their areas are the same. 

 Ask the students to make more such cutouts, say, 20, 25, 30, etc., and make different shapes.


Activity W2.6: Exploring Area – Same Area, Different Shapes Using Strips

Objective:

To understand that area remains the same when the total number of unit tiles is the same, even if their shapes and arrangements differ.

Materials Needed:

  • Cutouts of rectangular strips of size 1 unit × 1 unit

  • Grid or chart paper

  • Scissors and glue (optional)

  • Pencil or marker

Procedure:

  1. Take 16 unit strips (1 × 1) and arrange them in a 1 × 16 rectangle.

  2. Rearrange the same 16 unit strips into a 4 × 4 square.

  3. Rearrange them again into an 8 × 2 rectangle.

  4. Observe the shape, layout, and area of each figure.

  5. Try the same process with 20, 25, 30 unit strips.
    Form different rectangles or irregular shapes while using all the strips.

  6. Record your observations.

Examples & Shapes:

Total Unit StripsPossible ArrangementsArea (sq. units)
161×16, 2×8, 4×416
201×20, 2×10, 4×520
251×25, 5×525
301×30, 2×15, 3×10, 5×630


Discussion Questions:

  1. Are all these shapes the same?
    No. They have different shapes and dimensions.

  2. Do they cover the same area?
     Yes. All use the same number of unit strips (same total area).

  3. What do we learn from this?
     Area is about how much space is covered, not what shape it is.

  4. Can we create shapes other than rectangles with the same area?
     Yes! Irregular or L-shaped figures can also be formed using the same unit strips.

Conclusion:

Even though shapes and dimensions differ, the total area remains the same when the same number of unit strips are used. This reinforces the concept that area is independent of shape and is instead determined by the total number of unit squares/tiles used.

This hands-on approach strengthens spatial reasoning and understanding of measurement and geometry.


Class 6 NCERT bridge course Answers Activity W2.5: Area – Same Area, Different Shapes


Activity W2.5: Area – Same Area, Different Shapes

● Take 10 pieces of dimension 1 x 1 unit. 

● Look at some of the following arrangements


  • Do you find that all these arrangements occupy the same space, that is, they have the same area? 
  •  Make some more arrangements of squares in different ways. 
  •  What do you conclude?

Activity W2.5: Area – Same Area, Different Shapes

Objective:

To help students understand that area depends on the number of unit squares used, not the shape or arrangement. By arranging the same number of 1×1 unit squares in different ways, students see that the area remains constant.

Materials Needed:

  • 10 square tiles or paper cutouts of size 1 unit × 1 unit

  • Plain paper or grid paper

  • Scissors and glue (optional)

  • Pencil/pen for drawing shapes

Procedure:

  1. Take 10 square pieces of 1×1 unit.

  2. Arrange them in different shapes (straight line, L-shape, rectangle, zig-zag, etc.).

  3. Draw or trace the shapes on paper to compare.

  4. Observe and answer:

    • Do all the shapes cover the same area?

    • How do they look different?

Suggested Arrangements (Examples):

ShapeDescriptionArea
šŸ”²šŸ”²šŸ”²šŸ”²šŸ”²šŸ”²šŸ”²šŸ”²šŸ”²šŸ”²1 row of 10 tiles (10 × 1 rectangle)10 square units
šŸ”²šŸ”²šŸ”²šŸ”²šŸ”²
2 rows of 5 tiles each (5 × 2 rectangle)10 square units
šŸ”²
šŸ”²
šŸ”²
šŸ”²
šŸ”²
šŸ”²
šŸ”²
šŸ”²
šŸ”²
šŸ”²
1 column of 10 tiles (1 × 10 rectangle)10 square units
šŸ”²šŸ”²šŸ”²
šŸ”²šŸ”²šŸ”²
šŸ”²šŸ”²šŸ”²
šŸ”²
L-shaped with pieces stacked10 square units
Custom or irregular shape using all 10 tilesVarious10 square units

Discussion Questions:
  1. Do you find that all these arrangements occupy the same space, that is, they have the same area? 
            Yes. All arrangements use 10 unit squares, so they cover 10 square units, regardless of shape.
  1. Make some more arrangements of squares in different ways. 


  1. Do they look the same?
     No. The shapes look very different, even though the area is the same.

  2. What do you conclude? What does this tell you about area?
    Area depends on the number of square units used, not how they are arranged.

  3. Can different shapes have the same area?
    Yes! That's the key insight.

Conclusion:

This activity shows that different shapes can have the same area if they are made from the same number of unit squares. Area is a measure of how many square units cover a surface, not the shape or orientation of the figure.

Encourage students to explore:

  • Creative patterns

  • Symmetry

  • New composite shapes
    All with the same total area!


Class 6 NCERT bridge course Answers Activity W2.4 Exploring Volume – Making a Triangular-Shaped Box

Activity W2.4: Exploring Volume – Making a Triangular-Shaped Box

 Discuss and Explore: 

1. Do the above activity by making a triangular shaped box and discuss your observations.

Activity W2.4: Exploring Volume – Making a Triangular-Shaped Box

Objective:

To explore how the shape of the base affects the volume of a box when using the same-sized sheet of paper. In this activity, students will make a triangular prism from the same-sized sheet used in Activity W2.3 and compare its volume with rectangular-based boxes.

 Materials Needed:

  • 1 rectangular sheet of paper (same size as previous activity)

  • Power tape or glue

  • Ruler

  • Grains or rice for measuring volume

  • Empty container

 Procedure:

  1. Take a rectangular sheet (e.g., 20 cm × 16 cm).

  2. Fold or cut it to form a triangular prism box.

    • Fold the paper into a strip.

    • Roll or shape the cross-section into a triangle (e.g., equilateral or right-angled).

    • Tape or glue the edges securely.

  3. Seal one end of the prism to make a base.

  4. Pour grains/rice into the triangular box until full.

  5. Pour the contents into a measuring container or another rectangular box made from the same paper.

  6. Compare the amount of rice or volume occupied.

 A triangular prism made of paper


Example Calculation:

Let’s assume:

  • Base of triangle = 8 cm

  • Height of triangle = 5 cm

  • Length (height of prism) = 16 cm

Volume of triangular prism =

Area of triangle×Length=12×8×5×16=320 cm³\text{Area of triangle} \times \text{Length} = \frac{1}{2} \times 8 \times 5 \times 16 = 320 \text{ cm³}

Compare with:

  • Rectangular box from same paper = 640 cm³ (from W2.3)

  • Triangular box = 320 cm³

The triangular box holds less than the rectangular box made from the same paper.

Discussion Questions:

  1. Why do you think the triangular box holds less?
    Because the base of the triangle has less area than a rectangular base from the same paper.

  2. How does the shape of the base affect volume, even with the same surface area?
     Shapes with broader or fuller bases (like rectangles) tend to enclose more volume than narrow ones (like triangles), assuming the same height.

  3. What if you made a cylinder instead from the same paper? Would it hold more or less?
     You could explore this in the next activity!

Conclusion:

By folding the same-sized paper into different 3D shapes (rectangular, triangular), we observe that volume is influenced by the shape of the base. Even with identical surface area, design and folding technique can greatly impact how much a box can hold.

Class 6 NCERT bridge course Answers Activity W2.3 Volume – Making Boxes of Different Volumes

 Volume: Making boxes of different volume from same size paper: 

Activity W2.3 

 Take two rectangular papers of the same size and different colours (say blue and yellow). 

First take any paper, say blue colour, crease it along the larger side from the middle such that both parts become equal (Fig. 1).


Crease the same paper from the middle such that both parts become equal and this divides the paper in four equal parts (Fig. 2). 

 Now join the open sides of the paper with power tape and form a box (Fig. 3)

Do the same with another paper, say yellow colour, by creasing it along the shorter side and form another box (Fig. 4 and Fig.5). 


 Now put the blue box on the table vertically so that one open side faces the table and the other side upwards and fill it completely with rice/grains. 

Empty all the rice in a container and fill the yellow box with this rice. 

Does it fill the blue box completely or not?


Activity W2.3: Volume – Making Boxes of Different Volumes

Objective:
To explore how folding the same size paper in different ways creates boxes of different volumes.

 Materials Needed:

  • 2 rectangular sheets of the same size (different colors, e.g., blue and yellow)

  • Power tape or glue

  • Grains or rice

  • Container to transfer grains

 Procedure:

  1. Blue paper:
    Fold the paper in half along the longer side.
    Then fold it again along the shorter side, dividing it into four equal parts.

  2. Tape the open edges to form a tall box.

  3. Yellow paper:
    Fold it first along the shorter side, then in half again.
    Tape the open edges to form a shorter, wider box.

  4. Fill the blue box with rice.
    Pour the rice into the yellow box.

 Question:

Does the yellow box hold the same amount of rice as the blue one?

 Example Calculation:

Suppose each paper is 20 cm × 16 cm:

  • Blue box (base = 8 cm × 10 cm, height = 8 cm)
    Volume = 8 × 10 × 8 = 640 cm³

  • Yellow box (base = 16 cm × 5 cm, height = 5 cm)
    Volume = 16 × 5 × 5 = 400 cm³

Result: The blue box holds more!

Conclusion:

Even when using the same sheet size, the way you fold and form a box greatly affects its volume. Taller, narrower shapes can sometimes hold more than shorter, wider ones.


Class 6 NCERT bridge course Answers Activity W2.2 Exploring Shapes and Spaces in Our School

Activity W2.2: Exploring Shapes and Spaces in Our School

The activity can be extended to measuring rooms and other spaces of different shapes available in the school. 

Discussion may be held about that


Activity W2.2: Exploring Shapes and Spaces in Our School

Objective

Students will measure and compare the dimensions and boundaries (perimeters) of various rooms and spaces in their school using estimation and measuring tools. They will also identify the shapes of these spaces and discuss their characteristics.

Materials Needed

  • Measuring tapes or meter sticks

  • Notebooks or worksheets

  • Geometry tools (optional: rulers, chalk, string)

  • Camera or phone (optional for images)

  • Chalk for marking lengths on the floor (optional)

Instructions

Step 1: Select Spaces to Measure

Ask students to choose or assign different school areas, such as:

  • Classroom

  • Library

  • Playground

  • Corridor

  • Principal’s office

  • School garden or assembly area

Step 2: Measure Dimensions

Measure the length and width (or any relevant dimensions) of each space.

Examples:

  • Classroom: Length = 8 meters, Width = 6 meters

  • Library: Length = 10 meters, Width = 7 meters

  • Corridor: Length = 20 meters, Width = 3 meters

Step 3: Calculate the Perimeter

Use the formula based on the shape:

  • Rectangle/Square: Perimeter = 2 × (Length + Width)

  • L-Shaped or Irregular Space: Add all the outer edge lengths

Example:

  • Classroom: 2 × (8 + 6) = 28 meters

  • Library: 2 × (10 + 7) = 34 meters

Step 4: Identify the Shape

Discuss what shape each room or space is (rectangular, square, L-shape, circular, etc.).

Step 5: Compare Spaces

Create a comparison table for all the rooms:

  • Which room is the biggest?

  • Which has the longest perimeter?

  • Which has the most unusual shape?

Example

SpaceLength (m)Width (m)ShapePerimeter (m)Notes
Classroom86Rectangle28Regular shape
Library107Rectangle34Bigger than classroom
Corridor203Rectangle46Longest perimeter
GardenIrregular-Irregular~55 (estimated)Has many corners
  • Which room has the largest perimeter?

  • Which space is most difficult to measure? Why?

  • What challenges do we face when measuring curved or irregular shapes?

  • How can we estimate measurements when exact tools are not available?

  1. Diagram of a rectangular classroom with length and width labeled


Bird’s-eye view of school map, showing measured spaces


Students measuring a corridor using tape measure


Comparison chart of perimeters of different spaces

Comparison Chart: Perimeters of Different Spaces

Name of SpaceShapeDimensions (in m)Formula UsedPerimeter (in m)
ClassroomRectangleLength = 8, Width = 62 × (L + W)28
PlaygroundSquareSide = 304 × side120
GardenRectangleLength = 15, Width = 102 × (L + W)50
School BuildingIrregularSides = 10, 20, 15, 25Add all sides70
Circular FountainCircleRadius = 42 × Ļ€ × r ≈ 2 × 3.14 × 4≈ 25.12
Basketball CourtRectangleLength = 28, Width = 152 × (L + W)86
Football FieldRectangleLength = 100, Width = 502 × (L + W)300
Triangle ParkTriangleSides = 20, 20, 30Add all sides70


Sketch of irregular space (like L-shape) with perimeter shown as sum of edge lengths


Perimeter Comparison Chart

🧮 Interactive Worksheet: Perimeters of Different Spaces

Name of Space Shape Dimensions (in m) Formula Used Perimeter (in m)

šŸ“ Discussion Questions

  • Which space has the longest perimeter?
  • Which shapes have the simplest formulas?
  • How does changing dimensions (like length or radius) affect the perimeter?

Pages

A square and a cube Mind Map / Concept Map

// ========== TOPIC 14: MIND MAP / CONCEPT MAP (with Interactive Markmap) ========== addResource("🧠 Mind & Concept Map", [ ...