Thursday, August 10, 2023

Class 08 Games

 Class 08 Games

Box Game:

 A game for a group or a class.

Draw a "box" as shown.


The leader calls six digits from 0 to 9 inclusive, each one different.

As each digit is called you must write it in one of the six sections of the "box".

 You must write each digit in a section before the next digit is called.

To win you must have made the largest possible number.

The winner becomes the leader for the next round.


Class 08 Activity – Data handling3

 Class 08 Activity – Data handling3

Objective: 

To explore probability through a group activity.

Materials Required : 

Paper boxes of equal sizes full of beans, dice per pair of students, chart paper and pencil to record the information.

Procedure:

Divide the students into pairs and hand over each pair a dice, paper, pencil and paper box full of beans. 

The students will roll the dice, note the number that comes up and take out from the box that many beans until the box is empty. 

Each pair should play five times and record the number of rolls it takes each time to empty the box on the chart paper on the board.

Once all the pairs have recorded the information on art, ask the students to determine the most likely number of rolls it took to empty the box. They should also find out the fewest and the greatest number of rolls it could take to empty the box.


Class 08 Activity – Data handling2

 Class 08 Activity – Data handling2

Objective: 

To collect data and represent the same as a pie chart.

Materials Required:

 White sheets of paper, colour pencils, geometry box, etc.

Procedure:

Write how much time you spent during the last Monday in the following headings.


2. Now, find the central angle for each activity.
We know that central angle for a component  
= "Value of the component" /"Total value"  x 360°
Central angle for School  = πŸ”/πŸπŸ’ x 360° = 90°
Central angle for Homework = 𝟐/πŸπŸ’x 360° = 30°
Central angle for Play = 𝟐/πŸπŸ’ x 360 ° = 30°
Central angle for Watching T.V. = πŸ‘/πŸπŸ’ x 360 ° = 45°
Central angle for sleep  = πŸ–/πŸπŸ’ x 360 ° = 120°
Central angle for others = πŸ‘/πŸπŸ’ x 360° = 45°
3. Using a pair of compasses, draw a circle of any convenient radius and divide it into sectors of 90°, 30°, 30°, 45°,120° and 45°
Label the sectors accordingly and shade them using different colours.

Note: 

The data given above is for your comprehension. The students must do the activity and collect the data.


Class 08 Activity – Data handling

 Class 08 Activity – Data handling

Objective: 

To collect, classify and represent data as a histogram.

Materials Required: 

White sheets of paper, squared paper, colour pencils, a pair of scissors, glue stick, geometry box, etc.

Procedure:

1. For every student of your class (including yourself), find the number of hours he/ she spent in watching


 T.V. on the previous Sunday. The data may be recorded in the tabular form as shown below:

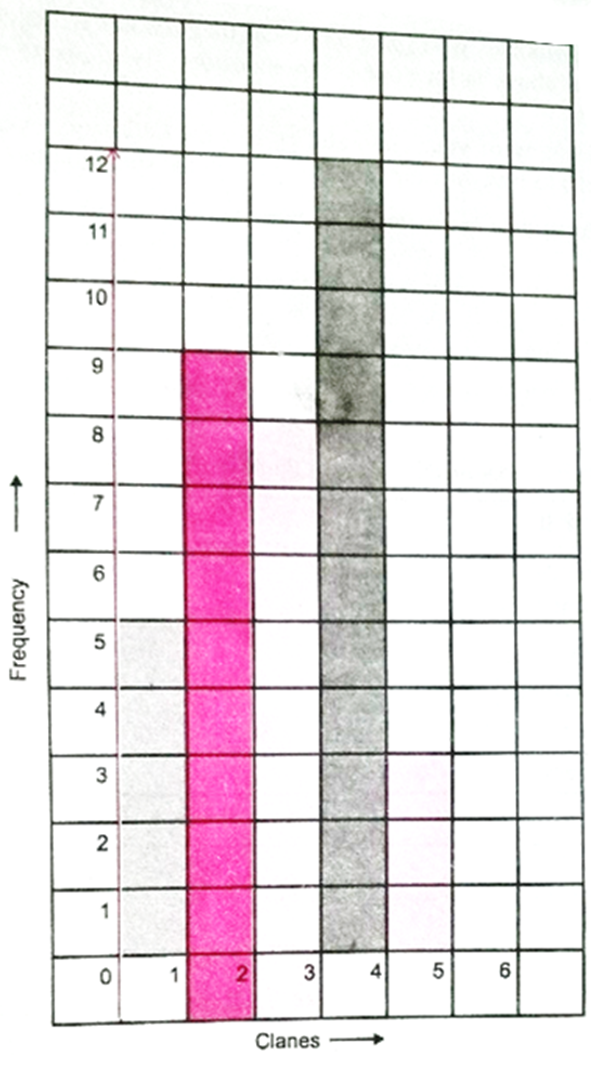
2. Now, draw a histogram on a squared paper representing the class intervals along the horizontal axis and the frequency along the vertical axis as shown below.

Observations:

The bar corresponding to the class 3-4 is longest, So, maximum number of students of your class spent 3 to 4 hours in watching T.V.

2. The bar corresponding to the class 4-5 is shortest. So, minimum number of students of your class spent 4 to 5 hours in watching T.V.


3. Length of the bar corresponding to the class 0-1 = 5

Length of the bar corresponding to the class 1-2 = 9

Length of the bar corresponding to the class 2-3 = 8

Length of the bar corresponding to the class 3-4 = 12

Length of the bar corresponding to the class 4-5 = 3

      Total = 37


Thus, there are 37 students in your class.

4. The number of students who spent less than 3 hours in watching T.V.= 5 + 9 + 8 = 225. 

The number of students who spent 3 or more than 3 hours in watching T.V. = 12 + 3 = 15

Note: The data given above is for your comprehension. The students must do the activity and collect the data.

Do Yourself:

 Do a survey of your class and collect the data from every student of your class(including yourself) to find the number of minutes he/ she spent in playing any outdoor game.

Represent the collected data in the form of a histogram.


CBSE Worksheet: Class 6 Maths – Chapter: Patterns in Mathematics

  CBSE Worksheet: Class 6 Maths – Chapter: Patterns in Mathematics Subject: Mathematics   Chapter: Patterns in Mathematics Class: VI   M...