Class 08 Activity – Data handling
Objective:
To collect, classify and represent data as a histogram.
Materials Required:
White sheets of paper, squared paper, colour pencils, a pair of scissors, glue stick, geometry box, etc.
Procedure:
1. For every student of your class (including yourself), find the number of hours he/ she spent in watching

T.V. on the previous Sunday. The data may be recorded in the tabular form as shown below:
2. Now, draw a histogram on a squared paper representing the class intervals along the horizontal axis and the frequency along the vertical axis as shown below.
Observations:
The bar corresponding to the class 3-4 is longest, So, maximum number of students of your class spent 3 to 4 hours in watching T.V.
2. The bar corresponding to the class 4-5 is shortest. So, minimum number of students of your class spent 4 to 5 hours in watching T.V.
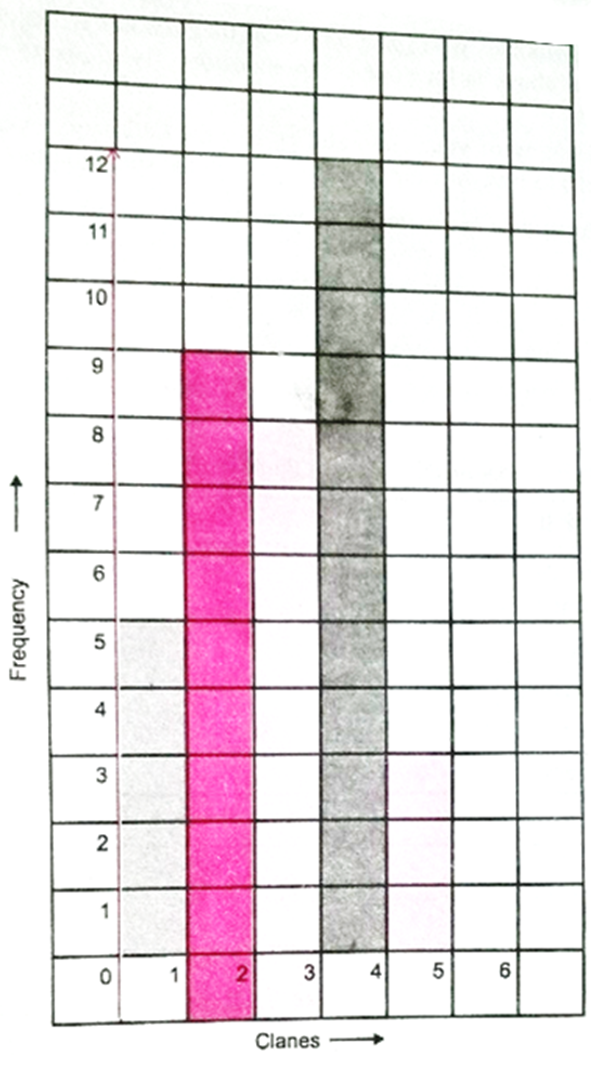
3. Length of the bar corresponding to the class 0-1 = 5
Length of the bar corresponding to the class 1-2 = 9
Length of the bar corresponding to the class 2-3 = 8
Length of the bar corresponding to the class 3-4 = 12
Length of the bar corresponding to the class 4-5 = 3
Total = 37
Thus, there are 37 students in your class.
4. The number of students who spent less than 3 hours in watching T.V.= 5 + 9 + 8 = 225.
The number of students who spent 3 or more than 3 hours in watching T.V. = 12 + 3 = 15
Note: The data given above is for your comprehension. The students must do the activity and collect the data.
Do Yourself:
Do a survey of your class and collect the data from every student of your class(including yourself) to find the number of minutes he/ she spent in playing any outdoor game.
Represent the collected data in the form of a histogram.
No comments:
Post a Comment