Activity W 4.6 A fractal
Objective:
This activity will help students to:
Materials Required:
Paper, markers, ruler (optional), printouts of
basic geometric shapes (triangles, squares, etc.).
A fractal is a shape or pattern that repeats itself no matter how
much you zoom into it.
Procedure
Guide students to build fractals step-by-step.
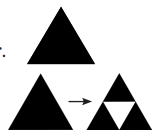
1. Draw a large equilateral triangle on your paper.
2. Find the midpoints of each side and join them.
Remove the middle triangle so obtained.
It will
look as shown—
3. Again, join the midpoints of each
of the sides of the three shaded
triangles.
Remove the three
triangles so obtained. It will look
like
4. Ask the students to continue the process for at least two more
times.
Take sufficiently large paper or cardboard for this purpose.
Reflection
Ask the students to describe the final structure they obtain.
ANSWER:
The final structure looks like a big triangle made up of smaller and smaller triangles.
Does the
final one looks like a big triangle made up of smaller triangles, and if
we zoom in,?
ANSWER:
Yes! If we zoom in, the same pattern keeps repeating — this is the main property of a fractal.
do we see the same pattern inside?
This is a fractal.
ANSWER:
A fractal shows self-similarity: no matter how much you zoom in or out, the shape looks the same.
Pattern Observation:
The number of triangles follows this pattern:
Number of shaded triangles = 3ⁿ (n = step number)
Extension
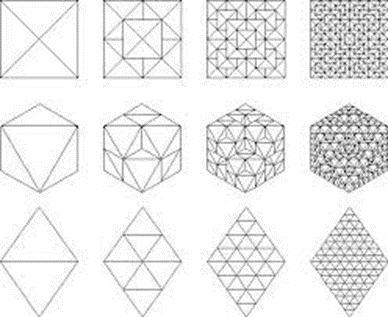
1. Students may try this for different shapes, such as square,
rectangle, parallelogram or any other shape of their choice.
Try this fractal pattern with other shapes like:
Squares – Sierpinski Carpet
-
Step 1: Start with one large square.
-
Step 2: Divide the square into 9 smaller squares (like a tic-tac-toe grid).
-
Remove the middle square.
-
Step 3: For each remaining square, repeat the same process: divide into 9 parts, remove the middle one.
-
Keep repeating!
👉 Pattern:
-
Number of remaining squares grows as 8ⁿ (n = step number).
-
Creates a flat, grid-like fractal called the Sierpinski Carpet.
Rectangles
-
Step 1: Start with a rectangle.
-
Step 2: Divide it into equal smaller rectangles (4, 6, 8 parts or more, depending on shape).
-
Remove a central part or selected parts.
-
Repeat the same for the remaining rectangles.
Pattern:
Parallelograms
-
Step 1: Start with a parallelogram.
-
Step 2: Divide it into smaller, identical parallelograms.
-
Remove one or more central parts.
-
Repeat the process for each remaining parallelogram.
Pattern:
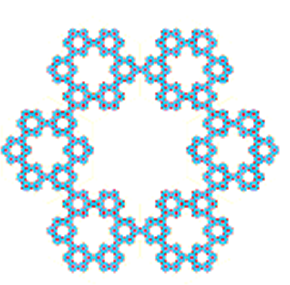
Hexagons
-
Step 1: Start with a regular hexagon.
-
Step 2: Divide the hexagon into 7 smaller hexagons (1 central + 6 surrounding).
-
Remove the central hexagon.
-
Repeat the process for each remaining hexagon.
Pattern:
-
A repeating honeycomb-like fractal — looks similar to snowflake patterns or beehives!
-
The edges form increasingly complex, yet balanced, hexagon-based designs.
No matter the shape — square, rectangle, parallelogram, or hexagon — when you:
-
Divide,
-
Remove parts,
-
Repeat the process...
...you create a fractal: a never-ending, self-similar, and geometric pattern.
2. Students may be asked to associate numbers with each shape.
Say, number of triangles obtained in each step or the number sides on outer edges in each step (3, 6, ...).
They need to find a pattern.
Pattern in Outer Edges
- As you remove triangles, the number of sides or edges grows.
- For each step, the outer shape becomes more detailed but still follows a predictable mathematical pattern.
Sierpinski Triangle
-
Number of Triangles at Each Step:
Pattern:
Number of triangles = 3ⁿ (where n = step number)
Outer Edges (Visible Triangle Sides):
Pattern:
Outer triangle sides double each step: 3 × 2ⁿ
Sierpinski Carpet (Square Fractal)
Number of Squares at Each Step:
Pattern:
Number of squares = 8ⁿ
Outer Edges:
Pattern:
Parallelogram Fractal (Custom logic – similar to square)
If we divide into 4 parts (2×2 layout) and remove the middle one:
Number of Parallelograms:
Pattern:
Just like triangle: 3ⁿ
Hexagon Fractal
(Similar to honeycomb — 7 small hexagons, remove the center)
Number of Hexagons:
Pattern:
Number of hexagons = 6ⁿ
Summary Table:
Conclusion:
A fractal is a fascinating geometric figure where the same pattern repeats itself at every scale.
The Sierpinski Triangle is a perfect example of this, and by exploring other shapes, we can discover many more fractals in nature and mathematics.