QUESTION BANK CLASS 8 DATA HANDLING
The information collected in all such cases is called data.
A Pictograph: Pictorial representation of data using symbols.
A bar graph: A display of information using bars of uniform width, their heights being proportional to the respective values.
Double Bar Graph: A bar graph showing two sets of data simultaneously. It is useful for the comparison of the data.
A circle graph shows the relationship between a whole and its parts. Here, the whole circle is divided into sectors. The size of each sector is proportional to the activity or information it represents.
A circle graph is also called a pie chart.
Each outcome of an experiment or a collection of outcomes make an event. For example in the experiment of tossing a coin, getting a Head is an event and getting a Tail is also an event.
In case of throwing a die, getting each of the outcomes 1, 2, 3, 4, 5 or 6 is an event.
1. In order to draw meaningful inferences from any data, we need to organise the data systematically.
2. Data can also be presented using circle graph or pie chart. A circle graph shows the relationship between a whole and its part
3. There are certain experiments whose outcomes have an equal chance of occurring.
4. A random experiment is one whose outcome cannot be predicted exactly in advance.
5. Outcomes of an experiment are equally likely if each has the same chance of occurring.
6. Probability of an event = , when the outcomes are equally likely.
7. One or more outcomes of an experiment make an event.
8. Chances and probability are related to real life.
EXAMPLE
A bag has 4 red balls and 2 yellow balls. (The balls are identical in all respects other than colour). A ball is drawn from the bag without looking into the bag. What is probability of getting a red ball? Is it more or less than getting a yellow ball?
Adjoining pie chart (Fig 4.4) gives the expenditure (in percentage) on various items and savings of a family during a month. (i) On which item, the expenditure was maximum? (ii) Expenditure on which item is equal to the total savings of the family? (iii) If the monthly savings of the family is ` 3000, what is the monthly expenditure on clothes?

1. A survey was made to find the type of music that a certain group of young people liked in a city. Adjoining pie chart shows the findings of this survey. From this pie chart answer the following:
(i) If 20 people liked classical music, how many young people were surveyed?
(ii) Which type of music is liked by the maximum number of people?
(iii) If a cassette company were to make 1000 CD’s, how many of each type would they make?

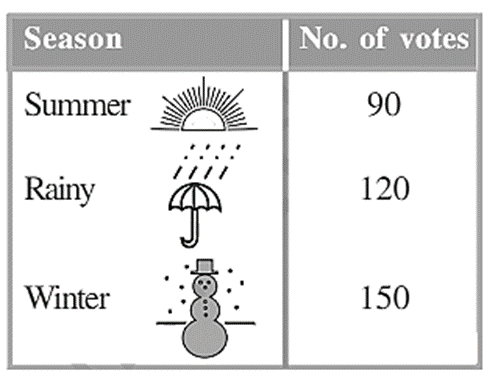
2. A group of 360 people were asked to vote for their favourite season from the three seasons rainy, winter and summer.
(i) Which season got the most votes?
(ii) Find the central angle of each sector.
(iii) Draw a pie chart to show this information.
3. Draw a pie chart showing the following information. The table shows the colours preferred by a group of people.
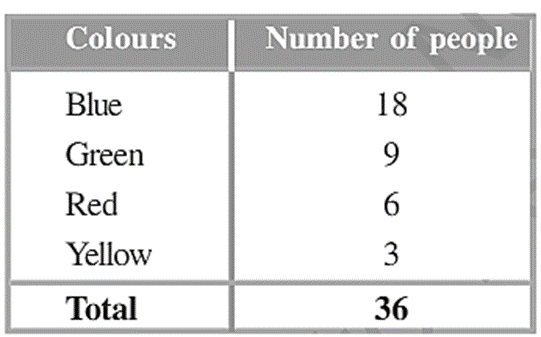
Colours Number of people
Blue 18
Green 9
Red 6
Yellow 3
Total 36
4. The adjoining pie chart gives the marks scored in an examination by a student in Hindi, English, Mathematics, Social Science and Science. If the total marks obtained by the students were 540, answer the following questions.
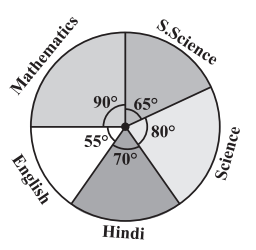
(i) In which subject did the student score 105
marks?
(Hint: for 540 marks, the central angle = 360°.
So, for 105 marks, what is the central angle?)
(ii) How many more marks were obtained by the student in Mathematics than in Hindi?
(iii) Examine whether the sum of the marks
obtained in Social Science and Mathematics
is more than that in Science and Hindi.
(Hint: Just study the central angles)
5. The number of students in a hostel, speaking different languages is given below. Display the data in a pie chart.

Language Hindi English Marathi Tamil Bengali Total
Number of students 40 12 9 7 4 72
EXERCISE 4.2
1. List the outcomes you can see in these experiments. (a) Spinning a wheel (b) Tossing two coins together
2. When a die is thrown, list the outcomes of an event of getting (i) (a) a prime number (b) not a prime number. (ii) (a) a number greater than 5 (b) a number not greater than 5.
3. Find the. (a) Probability of the pointer stopping on D in (Question 1-(a))?
(b) Probability of getting an ace from a well shuffled deck of 52 playing cards?
(c) Probability of getting a red apple. (See figure below)
4. Numbers 1 to 10 are written on ten separate slips (one number on one slip), kept in a box and mixed well. One slip is chosen from the box without looking into it.
What is the probability of .
(i) getting a number 6?
(ii) getting a number less than 6?
(iii) getting a number greater than 6?
(iv) getting a 1-digit number?
5. If you have a spinning wheel with 3 green sectors, 1 blue sector and 1 red sector, what is the probability of getting a green sector? What is the probability of getting a non blue sector?
6. Find the probabilities of the events given in Question 2.
No comments:
Post a Comment